Please take a look at the proposed infrastructure plan on The White House. Most of items fall into the category of “Government consumption expenditures and gross investment” defined by Bureau of Labor Statistics
Take a review on the analysis of fiscal policy by IS-LM model in lecture 6.
Please do the following work as your midterm project:
Rearrange the equation of IS relation and discuss how the IS curve will shift on the graph (Please draw the graph as well)
Put the LM curve on, discuss the shift of equilibrium (output and interest rate)
Explain the intuition of the effect of massive government spending(\(G\))
Starting from the direct effect on the goods market
Then go to indirect effect on financial market (money market)
To fund the massive government spending plan, the Administration propose tax hike as well. Discuss the possible effect of it (\(T\)). You may take a look at the discussion on Tax Foundation
Minimum Requirement: go to google slides, get add-on “MathType” (you need it to edit equation), choose a theme you like. then you can do your project following the listed steps.
At least 4 slides:
One for rearranged equation; explanation and draw a graph to show the shift of IS curve.
One for IS-LM graph to show the shift of equilibrium and explanation.
One for intuition of two markets adjustments.
One for general discussion about the effect of possible tax hike.
When you finish it, click “share” then choose available for view or edit by link inside Texas A&M university. Copy the link and paste into Canvas Midterm project then submit it.
In Midterm Project, we analyze proposed infrastructure plan by IS-LM (short run) model. Now we extend our analysis to medium run by AS-AD model.
Take a review on the analysis of fiscal policy by AS-AD model in lecture 15.
Please do the following work in google slides as your midterm project:
First slide will be Title “ECON410: Final Project” and subtitle your name.
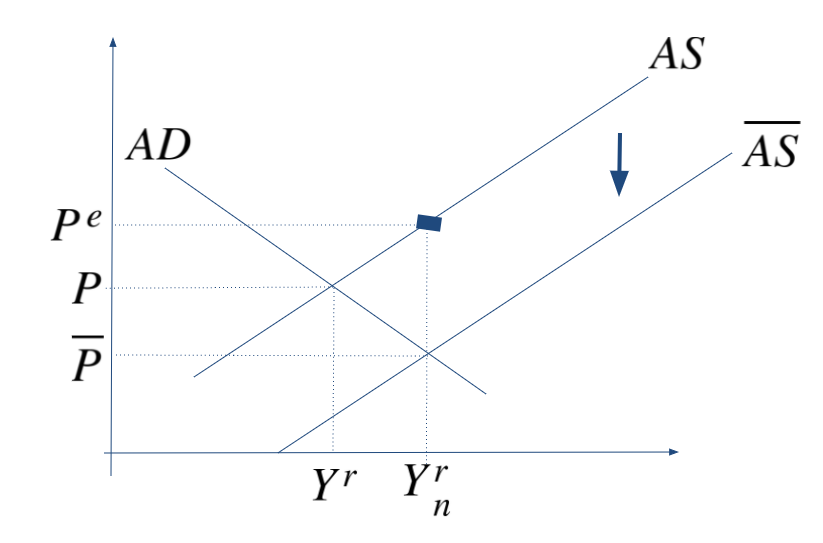
Copy the graph No Bill as second slide. Assume COVID-19 recession makes Aggregate demand curve on the left of labor market equilibrium. If No new government spending bill passed, the economy will change in a way like the graph shows. In the third slide, please explain what’s happening in this case according to the graph.
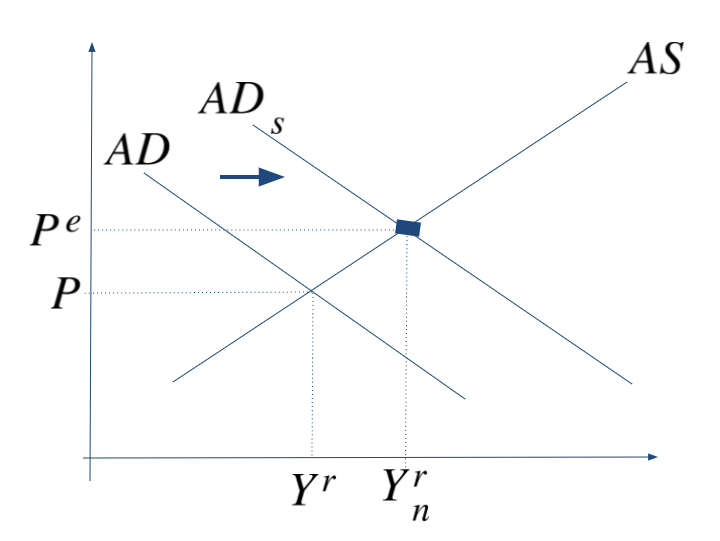
Copy the graph Small Bill as fourth slide. If a small government spending bill passed, the economy will change in a way like the graph shows. In the fifth slide, please explain what’s happening in this case according to the graph.
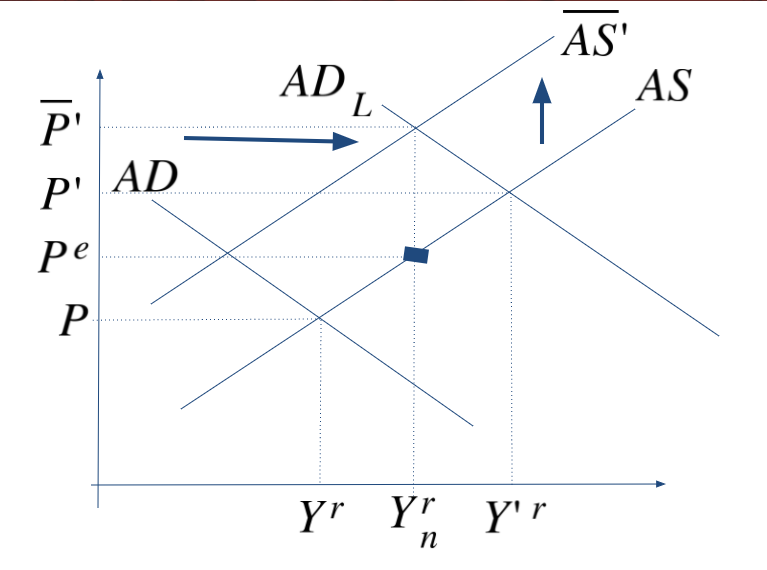
Copy the graph Large Bill as sixth slide. If a large government spending bill passed, the economy will change in a way like the graph shows. In the seventh slide, please explain what’s happening in this case according to the graph.
Note that it’s an “infrastructure” bill rather than a general government spending bill. If the bill really focuses on “infrastructure” (investment), what’s the effect on the economy in long run? Please put some general discussion on your last slide.
When you finish it, click “share” then choose available for view or edit by link inside Texas A&M university. Copy the link and paste into Canvas final project then submit it.